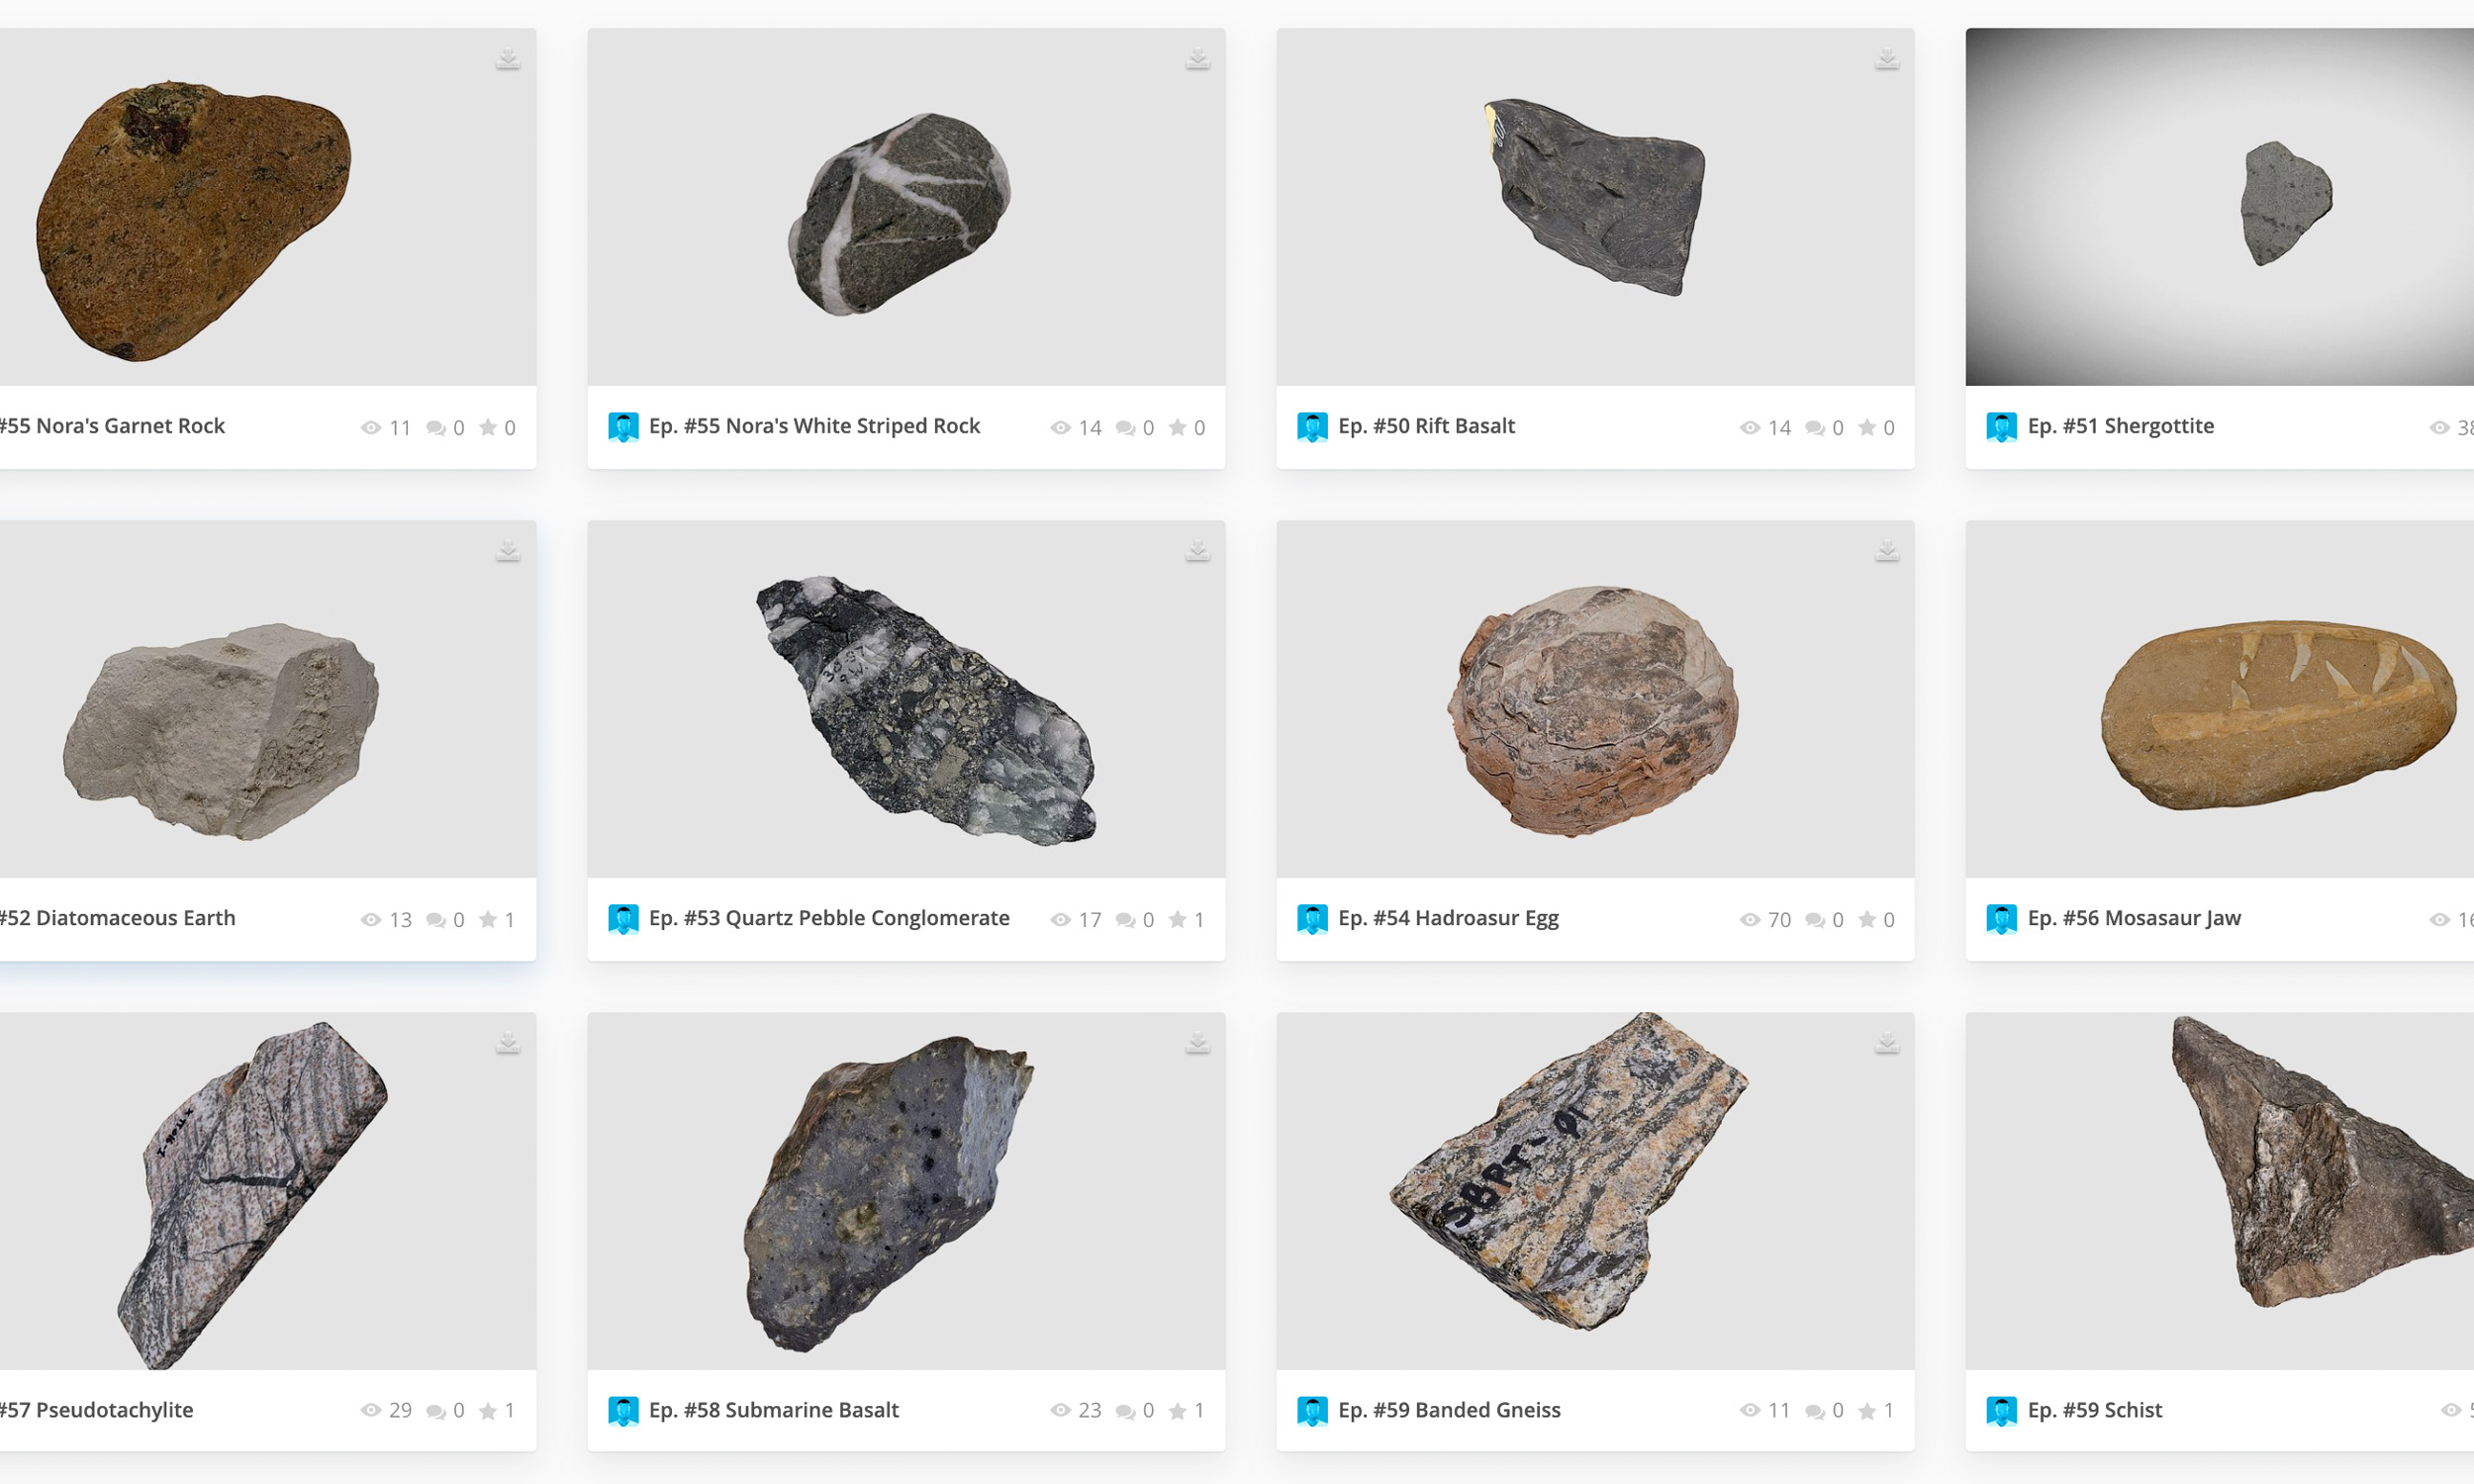
Author Archives: digischol

Joseph Becker, Railroad Pass with Chinese Workers, 1869-1870. Becker Archive, Boston College Fine Arts Dept.

Highlights from the 2019 Digital Scholarship Open House

On May 1, 2019 the Digital Scholarship Group hosted an Open House that featured the work of several faculty, graduate students, and librarians. Here is a brief overview of the presentations with links to slides and other materials shared kindly by the presenters.

Richard L. Sweeney (Assistant Professor, Economics Department) who participated in this past year’s GIS Faculty Cohort presented on his applications of spatial visualization and GIS for investigating the fracking boom.

Title page from The court & kitchin of Elizabeth, commonly called Joan Cromwel (1664)

Title page from The court & kitchin of Elizabeth, commonly called Joan Cromwel (1664)

Sharon Lacey (independent scholar) and Margaret Summerfield (PhD student, English Department) who participated in this past year’s Digital Scholarship Incubator each presented on their research projects. Lacey created a video discussing her research into how painting techniques in Europe developed across time in relation to other sociocultural factors. Summerfield presented on a collaborative transcription and annotation project (under development) with several faculty, students, and librarians, A Digital Scholarly Edition of The Court and Kitchin of Elizabeth, Commonly called Joan Cromwel (1664).

There were several presentations focused on collaborative projects or pedagogical support with librarians and faculty. Seth Meehan (Associate Director, Institute for Advanced Jesuit Studies), Anna Kijas (Senior Digital Scholarship Librarian) & Sarah DeLorme (Associate Digital Scholarship Librarian) presented on one of these projects, the Jesuit Online Bibliography, a recently launched bibliography database of scholarship in Jesuit Studies.

Stephen Sturgeon (Senior Digital Scholarship Librarian & Bibliographer for English) discussed the collaborative efforts that went into migrating and re-imagining metadata and records for the Becker Collection: Drawings of the American Civil War Era. Carling Hay (Assistant Professor, Department of Earth and Environmental Sciences) shared pedagogical approaches and tips for incorporating podcasting into her weather and climate class (EESC1172).


Header image: Joseph Becker, Railroad Pass with Chinese Workers, 1869-1870. Becker Archive, Boston College Fine Arts Dept.

Eric Fischer, See Something or Say Something: Boston. Used under a CC-BY license.

May 2019 Data Visualization Display @ O’Neill Library

During the month of May, the O’Neill Library digital display (by the POP collection) will showcase a selection of data visualizations created by undergraduate and graduate student award recipients from the 10th annual GIS Mapping contest. Past winning posters can be found in the university Institutional Repository, eScholarship@BC, under the category Juried Student Work. The entries of our newest winners will join this distinguished group.

First Place

Aleksandra Ostojic, Geology, Earth and Environmental Sciences, graduate prize: “Sedimentation Patterns in Nauset Marsh, MA.”

Zoe Fanning ‘20, International Studies; Ethics and International Social Justice, MCAS , undergraduate prize: “The Impact of Armed Conflict on Health Care Provision and Health Systems in Syria.”

Second Place

Krisztina Horvath, Economics, MCAS, graduate prize: “Adverse Selection in Health Insurance Marketplaces: A Spatial Analysis.”

Kaylie Danials ‘19, Political Science, MCAS, undergraduate prize: “Socioeconomic Status as an Indicator of Attention Deficit/Attention Deficit-Hyperactivity Disorder Prevalence in Youth Aged 4-17.”

Third Place

Shannon Crowley, Curriculum & Instruction, Lynch School of Education, graduate prize: “Using ArcGIS to Supplement Regression: Analysis of SPED Student Performance.”

Grace Harrington ‘19, Psychology, MCAS, undergraduate prize: “Social Determinants of Mental Health in Tamil Nadu, India.”

Florence Nightingale 1858 diagram of mortality rates

March 2019 Data Visualization Display @ O’Neill Library

For the months of March and April, the O’Neill digital display (by the POP collection) will feature a curated “Women Also Know Data” visualization display to highlight diagrams, projects, and software developed by women over the last 160 years.

Diagram of the Causes of Mortality in the Army in the East

Florence Nightingale (1820-1910) is commonly referred to as the founder of modern nursing, but did you know that she was also a statistician and created hand-drawn data visualizations? She created “coxcombs” (or diagrams) and used them to report on conditions of medical care during the Crimean War. The “Diagram of the Causes of Mortality in the Army in the East” (1858), is an example of a polar area diagram that depicts the number of soldiers’ deaths from preventable diseases (identified in blue, red, and black) according to month and year. Nightingale was recognized for her pioneering work and was the first woman elected (1859) into the Royal Statistical Society.

Los Angeles: The City and the Library

Dr. Colleen Jaurretche’s composition class at UCLA developed the “Los Angeles: The City and the Library” site as a way to explore the history of Los Angeles. This project exemplifies how faculty can collaborate with librarians and archivists on a course-long assignment. Students attended library research sessions to develop their research paper topics and worked with the UCLA Special Collections to select images and create annotations about the materials examined in the archive, plotting each artifact on a map. The infrastructure for this project is built on Flâneur, a Jekyll theme for maps and texts, developed by Dawn Childress (UCLA, Digital Scholarship Librarian) & Niqui O’Neil (NCSU, Digital Technologies Development Librarian).

Dear Data: A friendship in data, drawing and postcards

Giorgia Lupi, an information designer, artist and entrepreneur, and Stefanie Posavec, a designer embarked on a year long project during which they hand drew data visualizations on postcards and mailed them to each other across the Atlantic. Their visualizations were based on the data they collected about their lives, including such things as door patterns, laughter, clocks, and so on. You can find images of the postcards on their project site, as well as a few videos.

Deconstructing Space Oddity one dimension at a time

Following the death of musician David Bowie (1947-2016), designer Valentina D’Efilippo and researcher Miriam Quick, developed “Deconstructing Space Oddity one dimension at a time” project in which they visualized data from Bowie’s song, “Space Oddity,” written in 1969. They selected this piece due to its significance in Bowie’s legacy, because it was his first breakthrough single, first British top 5 hit, and his first US Top 20. D’Efilippo and Quick deconstructed the song and visualized data according to narrative, recording, texture, rhythm, harmony, structure, melody, lyrics, trip, and emotions. For example, the data about the recording visualizes the master tracks of this song, including the lead vocals, backing vocals, and instrumentation (flute, strings, mellotron, stylophone, guitar, bass, and drums).

The Women of Data Viz

Alli Torban, a data visualization designer, created this visualization based on survey results collected by Elijah Meeks. 142 women who identify as data visualization practitioners took the survey and responded to questions about themselves and their work. Torban’s visualization is a example of a free-form visualization of data that can be as she puts it is “not only beautiful and engaging, but also something that helps you connect with your data.” Torban hosts a podcast called “Data Viz Today” and you can hear more about this visualization and other projects in Episode 28: How to Build a Connection With Your Data Through Original Visualization. You can also view the Meeks’ original survey data and results in his GitHub repository, https://github.com/emeeks/data_visualization_survey.


The visualization display is curated by Allison Xu (Data and Visualization Librarian) and Anna Kijas (Digital Scholarship Librarian).

front cover of Thomas D. Craven diary

Encoding the Thomas D. Craven Diary

In the spring of 2018, several library and archives staff from Thomas P. O’Neill (Nancy Adams, Meg Critch, Sarah DeLorme, Anna Kijas) and John J. Burns Library (Kathleen Monahan, Annalisa Moretti) began a collaborative transcription and encoding project of a 1917 diary written by Boston College student, Thomas D. Craven. This diary was written during the spring semester of Craven’s senior year when he began serving in the Army Air Corps Medical Corps during World War I.

Thomas D. Craven, c.1917

Thomas D. Craven (The Sub turri: The Yearbook of Boston College, 1917).

Nancy and I created a Guide to Transcription to help guide the transcription process for the team members. This guide also provides basic TEI encoding directions, because we wanted to begin identifying elements and attributes as we transcribed each entry with the hope that it would make the later review and encoding phase a bit easier and streamlined. After the project team reviewed the guide and provided input, everyone began transcribing approximately 50 entries per person. Kathleen and Sarah began working on a prosopography to identify people, places, and organizations mentioned in the diary. Meg began developing the TEI header for the diary, which will include descriptions about the electronic edition and manuscript source. The transcription phase was completed in December 2018 and the next phase has begun to review and make corrections, as well as do a closer encoding of the text.

Here is the first page from the diary dated January 1, 1917 followed by the first draft of the encoded transcription:

Page 1 of Thomas D. Craven Diary from January 1, 1917

Diary entry dated January 1, 1917


Encoded transcription of diary entry dated January 1, 1917

Encoded transcription of diary entry dated January 1, 1917

Our next task is to review the transcriptions and further encode the text according to the TEI. This will also require a discussion on the use of specific elements and attributes. The group agreed that we will use TAPAS to render and publish the TEI files from this project, although we may consider creating a stand alone project website where we can present the edition with additional content, images, or visualizations.

The work of this group aims to not only make this content more accessible and visible to a wider community, but to expand our own expertise and understanding of the TEI through project-based learning. The TEI files and guidelines will demonstrate how we chose to encode these texts and can be re-used for other projects or pedagogical purposes. In addition, encoding these materials will make them easier to discover and access online and will further promote the John J. Burns Library collections. Project-based learning can be used as a model for future initiatives at Boston College that aim to develop expertise and skills in areas of digital scholarship.

This project is currently under development, but you can view a sample of encoded text from this diary (created previously) and other special collections materials found in our TEI Learning Docs project hosted in TAPAS. It is part of our ongoing effort to learn the TEI, explore research and pedagogical applications of the TEI to primary source documents, and make the process and contents visible and accessible to a wider community of students, scholars, and archives/library professionals.


Source citation: Diary, Thomas D. Craven papers, BC.2004.121, John J. Burns Library, Boston College, http://hdl.handle.net/2345.2/BC2004_121_ref5.

Making a Podcast with Audacity

This tutorial was written by Sarah DeLorme, Associate Digital Scholarship Librarian.

The Digital Studio gets a lot of queries from our patrons regarding audio editing. There are so many great programs to choose from, it can be sometimes be overwhelming to know where to start. Audacity is a professional quality open source audio editor. It is intuitive to use and can easily be used to put together a great podcast.

Setting up

Before you even open the Audacity software, it is important to set yourself up for success in your recording. Audacity will let you connect to an external microphone, or the built in microphone at your workstation. Whichever recording device you choose, be sure to record in a quiet indoor space where you will not be interrupted. (A great place to record is the Sound Room in the Digital Studio. You can even reserve it online!) It also helps to work from a script, so that you can practice and pace yourself as you go along.

Recording

When you open Audacity, you will see this blank workspace.

Use the dropdown menus to select your recording device and your recording mode (you can choose either mono or stereo- mono is recommended for podcasts).

Click on the top numbered bar to check the input levels of your microphone. Try to keep at least a foot of space between yourself and the microphone, and speak clearly and at a moderate volume. The ideal range is a fully green bar. Avoid orange and red levels- that means you are too close or too loud!

Press the red circle button to begin your recording. (Helpful hint: leave a few seconds of empty noise at the start of the recording to sample during the noise reduction process later.) As you record, a waveform will appear on the track. Try to keep your waveform at a relatively similar level throughout, so that the volume is not fluctuating. Avoid very small waveforms which might be too soft to hear, as well as very large waveforms which might be so loud you get feedback.

Noise Reduction

Using the select tool (⌶) click and drag to highlight an empty noise portion of your recording. If you left a few seconds of silence before you started recording, use that! Otherwise, try to find a pause in the recording.

On the top menu, select effect> Noise Reduction> Get noise profile.

Next, use Command + A (CTRL+A on Windows) to select the entire track. It will look like this:

Navigate back to the noise reduction panel (Effect>Noise Reduction) and select “OK”. You will notice that your waveform will smooth out as the effect erases some of the background noise.

Creating a Second Track

Go to Tracks>Add new> Mono track. Remember, the new track will begin recording wherever the playhead is. Drag the playhead to the end of the first recording to make a seamless transition, like this:

You can move the clip around the track by selecting the “timeshift” tool (which looks like a double-headed arrow), clicking the clip, and dragging it to the desired position. You can also reorder the tracks by clicking and holding in the blank space of the left hand track menu and dragging up or down.

Deleting portions of your recording

Use the select tool to highlight the part of the recording you want to delete. (Helpful hint: use the zoom tool (🔍) to magnify the waveform and zero in on the word or phrase you wish to remove) Press the “Delete” button to remove the selected recording.

Importing and Exporting

Most podcasts have some catchy into music, and Audacity makes it easy to import a music file.  Go to File>import>audio and select the desired track. This will import the entire song. Trim the track to desired length by highlighting the extra music and pressing the delete button. To fade out, highlight the clip and go to Effects>Fade out. You will see the waveform change into a cone shape as the music tapers off.

NOTE: If you are using music in your podcast, it is very important to make sure you are not infringing on the artist’s copyright. If you are unsure about whether or not you can use a clip, ask a librarian- they can help!

To export your project as a final sound file, navigate to File>export> and select your preferred file type.

NOTE: To export an .mp3, Audacity will require you to download an additional file from their website. This is an mp3 encoding library. The prompt will provide you with a link to the download, as well as instructions. (This site is also full of tips and tutorials if you need further assistance with Audacity.)

Once your project is exported, you can open it in any program that plays audio files. However, it will be compressed, so you cannot go back and edit it. To preserve the tracks so that you can go back and edit them, you will need to save your project.

Saving your Project

Select File> Save  Project. This will save your project as an .aup file, preserving your track information so that you can open it up again later to edit it. You will only be able to open an .aup file in Audacity. This can be edited from any computer, as long as Audacity is installed.

NOTE:When you save your project, it will generate a project file (yourtitle.AUP) and a project folder (yourtitle_data).

Be sure to save both of these to your Google Drive, flash drive, or wherever you are saving your project. The folder contains your assets, and the .aup file contains the blueprint for your project. You will need both to reopen your project successfully!

If you need further assistance with your podcast, you can always contact the Digital Studio staff at digitalstudio@bc.edu


Visualization from Boston College tree inventory, 2010 GIS poster

November 2018 Data Visualization Display @ O’Neill Library

November 14 is GIS Day, but at O’Neill Library we’ll be celebrating all month-long! Stop by the GIS themed book display (curated by Barbara Mento) in the third floor lobby and check out the visualizations on the digital display (next to the POP collection). The display will showcase a selection of data visualizations created by Boston College undergraduate and graduate students, faculty, and staff using a variety of GIS software and platforms. Each source is linked to the original site where you can further explore the associated data, visualization, or literature.

The Boston College Tree Inventory poster created by Kevin Keegan received first place in the 2010 Geographic Information Systems (GIS) Mapping Contest at Boston College. He created the visualization in ArcMap (ArcGIS) and used data collected about trees on the Newton, Chestnut Hill, and Brighton campuses. The data inventory was created by the Office of Sustainability at Boston College with the goal of demonstrating Boston College’s carbon footprint.

The Seismic Map for New England and adjacent regions created by the Weston Observatory visualizes seismic activity and earthquake epicenters in the area for the period of January 1975 to October 2013. The Weston Observatory records earthquake activity (since the 1930s!) using seismic instruments with an emphasis on the northeastern United States. You can view a live feed of seismic activity in the region via the New England Seismic Network station. If you are in the O’Neill Library you can view seismic activity on the seismograph in the study area on Level One.

If you have ever wondered where most of the Boston College undergraduate students come from, you can find this answer in the Geographic Distribution of Undergraduate Students resource. This visualization created using Tableau software depicts enrollment over time per state/province and enrollment by US Census Region from 1976 through 2017. The data is drawn from several sources, including Institutional Research, Planning & Assessment, Office of Student Services, Registrar, U.S. Census Regions. A similar visualization was created to show where graduate international students come from and how enrollment has changed since 1991 through 2018. The underlying data was drawn from the Office of International Students and Scholars and Office of Dean for Student Development at Boston College. Both of these visualizations were created by the Office of Institutional Research, Planning & Assessment.

Each year the Boston College Libraries hold a GIS contest. Students are encouraged to submit their mapping work and top entries will be awarded to undergraduate and graduate students! The deadline for the 2019 contest is April 4, 2019. The first place winners from 2018 were Michaela Simoneau (Undergraduate, International Studies, Biology/MCAS) for The Plight of the Rohingya Refugee: Assessing current and predicted health and sanitation challenges and Abolfazl Sotoudeh-Sherbaf (Graduate, Sociology) for Iran’s 2018 Protests: Spatial Diffusion, Socio-Economics, and Climate Change.

Screenshot of Global Map of Wind project

October 2018 Data Visualization Display @ O’Neill Library

During Open Access October, the O’Neill Library digital display (by the POP collection) will showcase a selection of data visualizations that use open data about weather, climate, the environment, and of course, baseball! Each source is linked to the original site where you can further explore the associated data, visualization, or literature.

Climate Ready Boston Map Explorer is a mapping tool (Esri ArcGIS) that enables visitors to explore areas of the city that are at risk of flooding and extreme heat due to changes in our climate. It also features social vulnerability layers for demographic information including income, race, disability, age, language, and disease. The underlying open data (hosted in Analyze Boston) is from the Climate Ready Boston initiative that aims to “help Boston plan for the future impacts of climate change.”

MIT Treepedia is an interactive visualization that measures the canopy cover (street-level) in cities around the world. It was created by Carlo Ratti, Ian Seiferling, Xiaojiang Li, Newsha Ghaeli, and Wonyoung So at the Senseable City Laboratory, MIT. This project uses open data and is available on GitHub for anyone to use, so go ahead and visualize the tree cover for a city of your choosing!

Life and Death of Data is a very interesting project that makes us consider data as artifact. It also weaves narrative and interviews from Arboretum staff with data visualization. The project was developed by Yanni Alexander Loukissas in collaboration with Krystelle Denis, metaLAB and Arnold Arboretum. The team explored the scientific and cultural history of the Arboretum’s 142 years through its metadata, documenting changes in accession practices, data management approaches, and institutional development.

The Visual Baseball Project is a social network visualization created by Ken Cherven. Boston is a bit baseball crazy, so this visualization had to make its way into our display. It shows the connections between Red Sox players on team rosters from 1901 to 2017. He uses Gephi and sigma.js software to generate and render the graph and provides multi-part tutorials on his blog for anyone interested in creating a similar visualization or recreating one using the underlying data from this project. Go Sox!

An Interactive Visualization of NYC Street Trees is a neat project that uses data from 2005 and 2015 hosted in the NYC Open Data repository to visualize the variety and quantity of trees along streets in New York City’s boroughs. The concept and design is by Cloudred and programming is by Cristian Zapata.

The Global Map of Wind is a visualization of global weather conditions and was developed by Cameron Beccario. The map data is from Natural Earth and the weather data is updated from several sources that produce weather forecast, ocean surface current estimates, ocean surface temperatures and anomaly, ocean waves, and aurora data. The data sources and project code are available in this GitHub repository, cambecc/earth.

Map depicting ICE facilities across the United States

September 2018 Data Visualization Display @ O’Neill Library

During the month of September, the O’Neill Library digital display (by the POP collection) will showcase a selection of data visualizations created by students, scholars, librarians, and developers working around the world. These visualizations demonstrate how data analysis and visualization is used across disciplines and fields. Each source is linked to the original site where you can further explore the associated data, visualization, or literature.

Torn Apart/Separados was created in 6 days through the collaborative efforts of Manan Ahmed, Maira E. Álvarez, Sylvia A. Fernández, Alex Gil, Merisa Martinez, Moacir P. de Sá Pereira, Linda Rodriguez, and Roopika Risam. This project is a response to the United States 2018 Zero Tolerance Policy which resulted in the separation of thousands of children from their parents and families. The team used publicly available data to build the visualization and site with Leaflet, D3.js, Bootstrap, and Jekyll.

Where Historians Work: Careers Beyond the Professoriate is an interactive, online database that catalogues the career outcomes of the 8,515 historians who earned PhDs at U.S. universities from 2004 and 2013. This visualization, created in Tableau, depicts careers pursued by History PhDs beyond the academy. Initial findings are discussed in “Every Historian Counts: A New AHA Database Analyzes Careers for PhDs,” by Emily Swafford and Dylan Ruediger (July 9, 2018). The visualization was created by American Historical Association’s Career Diversity for Historians initiative, funded by the Andrew W. Mellon Foundation.

Female Nobel Laureates visualization by David Hoskins (Data Visualizaton Specialist) uses data from 1901 through 2017 to demonstrate the underrepresentation of women, primarily in science, but also other disciplines, who have received the Nobel Prize. The interactive chart was created in Tableau and includes profiles of each female Nobel laureate, including a photo. The dataset was provided by the Midlands Tableau User Group in Nottingham, England.

Crisis in the Humanities is a post by Ben Schmidt (Northeastern University) in which he examines the crisis in the humanities, charting the trends in humanities degrees between 1948 and 2017. Using historical U.S. degree data from NCES-IPEDS, Schmidt uses data analysis and renders visualizations in R to demonstrate how the last five years have been most brutal for humanities majors.

World Cup Most Valuable Players visualizes the players who touched the ball most often during the 2014 and 2018 World Cups. The interactive dashboard uses data from Opta Sports and was created by Felipe Hoffa using BigQuery and Data Studio.

screenshot for google search on the term "music composers"

Music Encoding Conference Keynote

Last week (May 22-25, 2018) I attended the Music Encoding Conference at the University of Maryland, College Park and gave the closing keynote on May 24. In my keynote, “What does the data tell us?: Representation, Canon, and Music Encoding,” I explored issues embedded in musicological traditions of canonicity and discussed the need for recovery of underrepresented composers in order to build a more inclusive digital canon. You can read the full text of this keynote here.

Illustration of Whaling Ship

May 2018 Data Visualization Display @ O’Neill Library

During the month of May, the O’Neill Library digital display (by the POP collection) will showcase a selection of data visualizations created by Boston College faculty, students, and staff. This month we are also including the winning visualizations from the 9th annual GIS Mapping contest. Each source is linked to the original site (when available) where you can further explore the associated data, visualization, or literature.

Mapping Chaucer. The Canterbury Tales – Dr. Eric Weiskott (English Department) created a map tour, in MediaKron, of the frame narrative of the Canterbury Tales with his ENGL3393: Chaucer course.

Seamus Connolly Collection Network – Anna Kijas (Digital Scholarship Librarian) visualizes the relationships between the musicians in the Seamus Connolly Collection of Irish Music. The network graph was created in Gephi and rendered with the SigmaJS library.

Global Boston – Eras of Migration – Dr. Marilynn Johnson (History Department) highlights different periods in Boston’s immigration history in a timeline built with TimelineJS.

GIS Poster winners