Blog
-

Digital Studio: New Gaming & Immersive Room
We are pleased to announce the Digital Studio’s new Gaming and Immersive Room (formally the Sound Room). With the growing demand for video games and immersive experiences in teaching and learning, this space allows faculty to incorporate these media into their instruction and students into their course assignments by creating easy access to the necessary…
-

How Did They Make That? Learning Series (Fall 2024)
This year, the Digital Scholarship Group is taking inspiration from Miriam Posner’s famous blog post, How Did They Make That?, and offering a learning series on how specific digital scholarship and digital humanities projects were created. Our intention is to give people a greater sense of what it takes to do this work, including what skills are…
-

Summer Educational Video Series
This summer, the DSG created a series of informative videos to help people understand aspects of DS, DH, and technology more broadly. We hope that our work will be helpful to BC and beyond and encourage the use of our videos in courses and resources such as finding aids. These videos are licensed under CC…
-

A Quick and Critical Dive into AI
This summer, we are creating a series of informative videos to help people understand aspects of DS, DH, and technology more broadly. In this video, Dave Thomas provides critical and thought-provoking insights into AI.
-
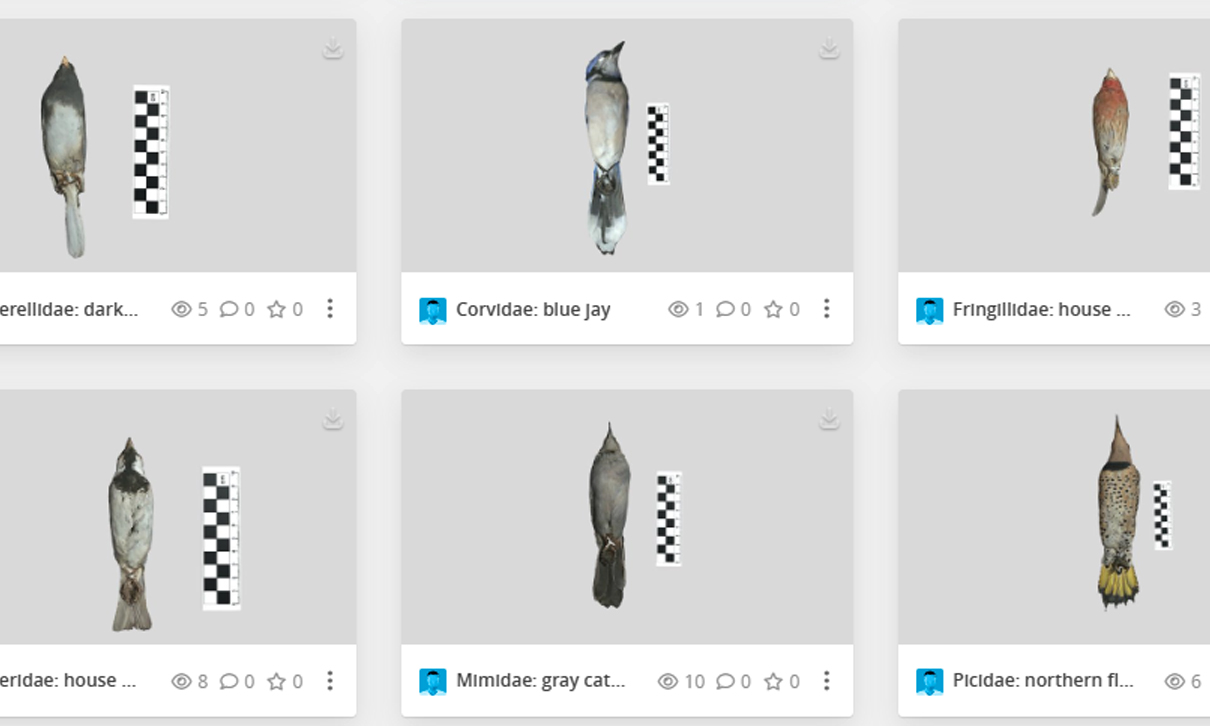
It’s a Bird! It’s a Project! It’s a Bird Project!
You may have observed some seemingly odd experiments if you’ve walked past the Digital Studio this semester. What are all those flashing lights, and are those… birds? In reality, what you’re witnessing is an important contribution to undergraduate pedagogy here at BC. Hands-on time with specimens is a critical component of any Biology curriculum, especially…
-
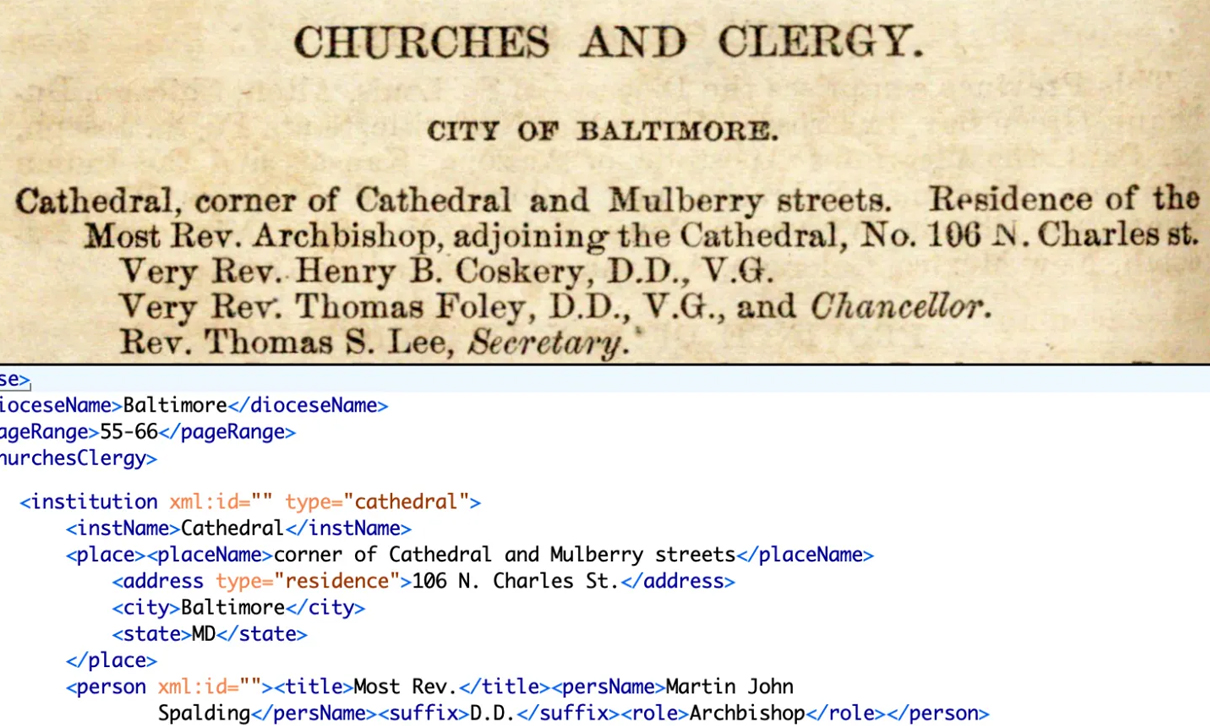
Catholic Almanacs Project Getting Off The Ground
One unexpectedly rich source about the history of Catholicism in the United States is a series of Catholic almanacs containing extensive data about US dioceses throughout the nineteenth century. Today, the almanacs are housed at Boston College Libraries, and some are digitized and made available by Villanova, HathiTrust, and the Internet Archive. Now, as part…
You must be logged in to post a comment.