Category: Projects
-
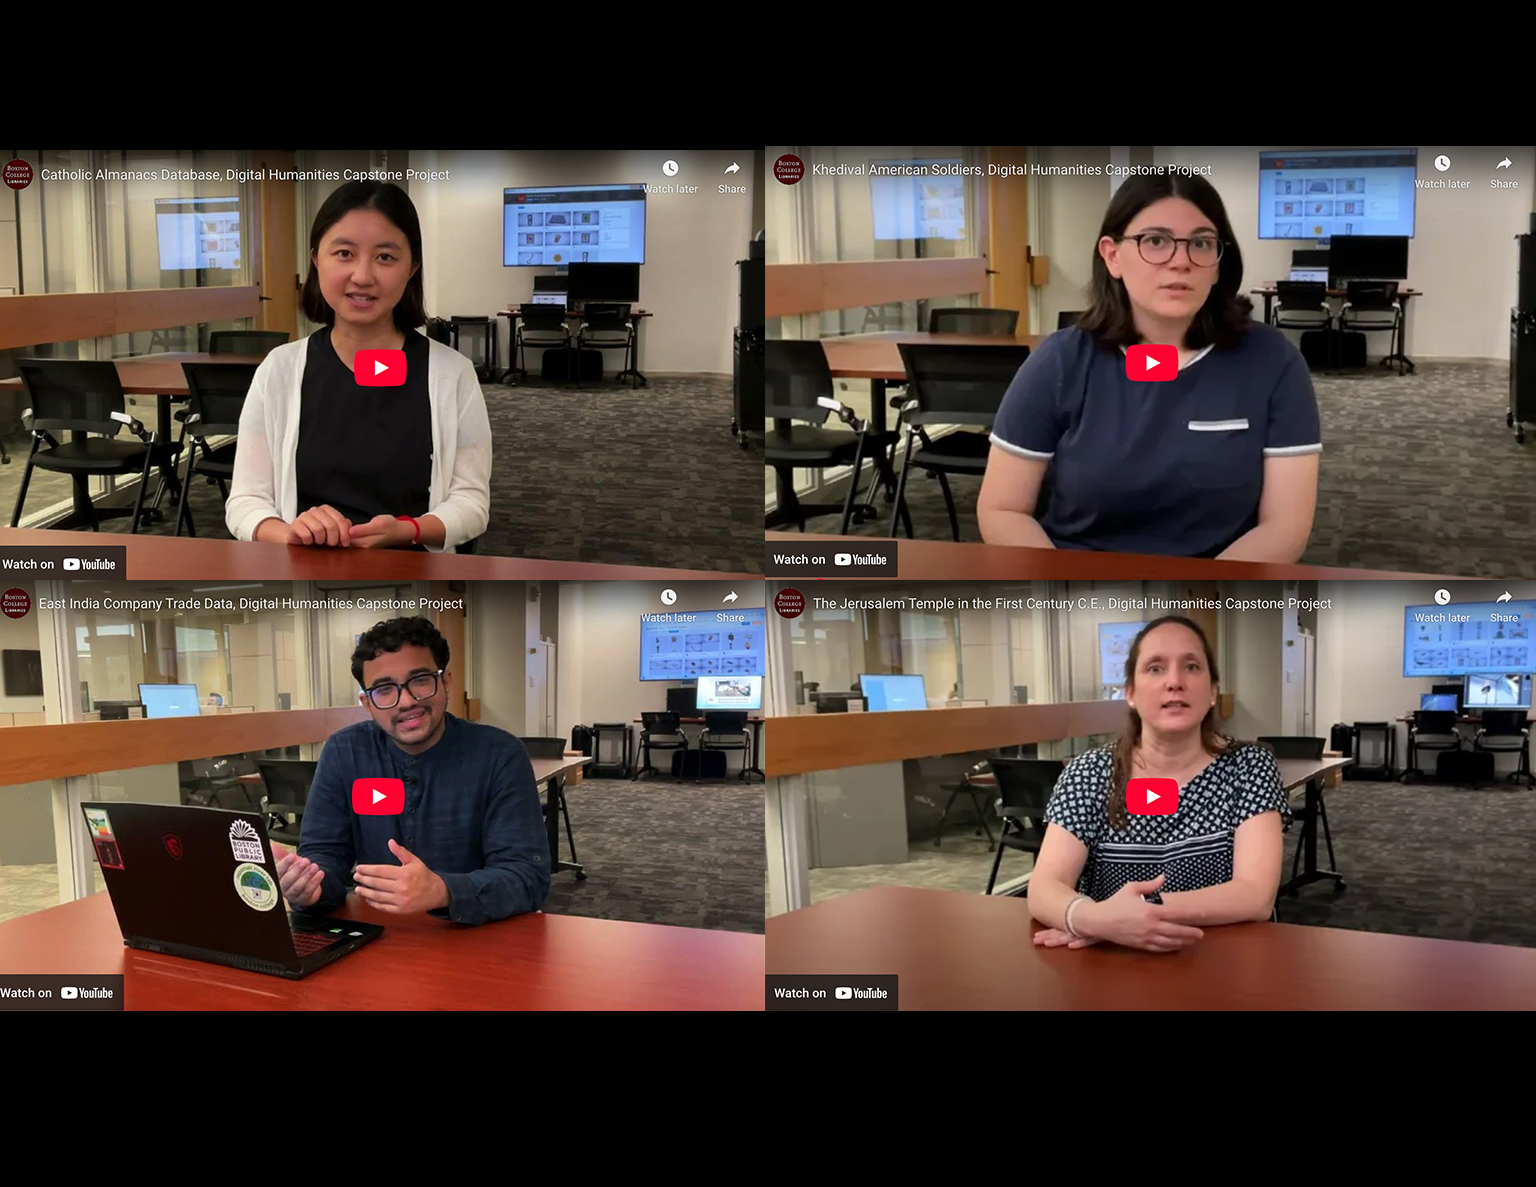
Digital Humanities Capstone Students Share About Their Projects
This summer, some of our terrific Graduate Certificate in Digital Humanities students sat down to talk with us about their projects–what they did, how they did it, and what they got from the experience. The intention of these videos is to help students understand what is possible and inspire them to take on their own…
-
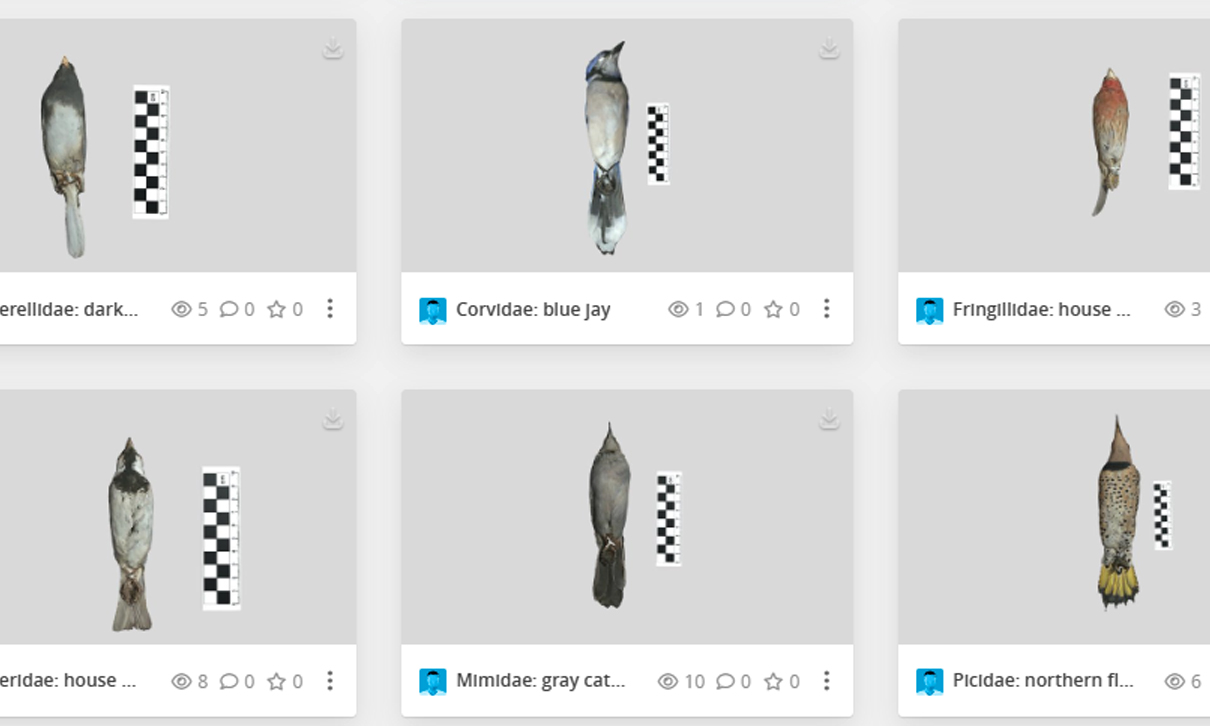
It’s a Bird! It’s a Project! It’s a Bird Project!
You may have observed some seemingly odd experiments if you’ve walked past the Digital Studio this semester. What are all those flashing lights, and are those… birds? In reality, what you’re witnessing is an important contribution to undergraduate pedagogy here at BC. Hands-on time with specimens is a critical component of any Biology curriculum, especially…
-
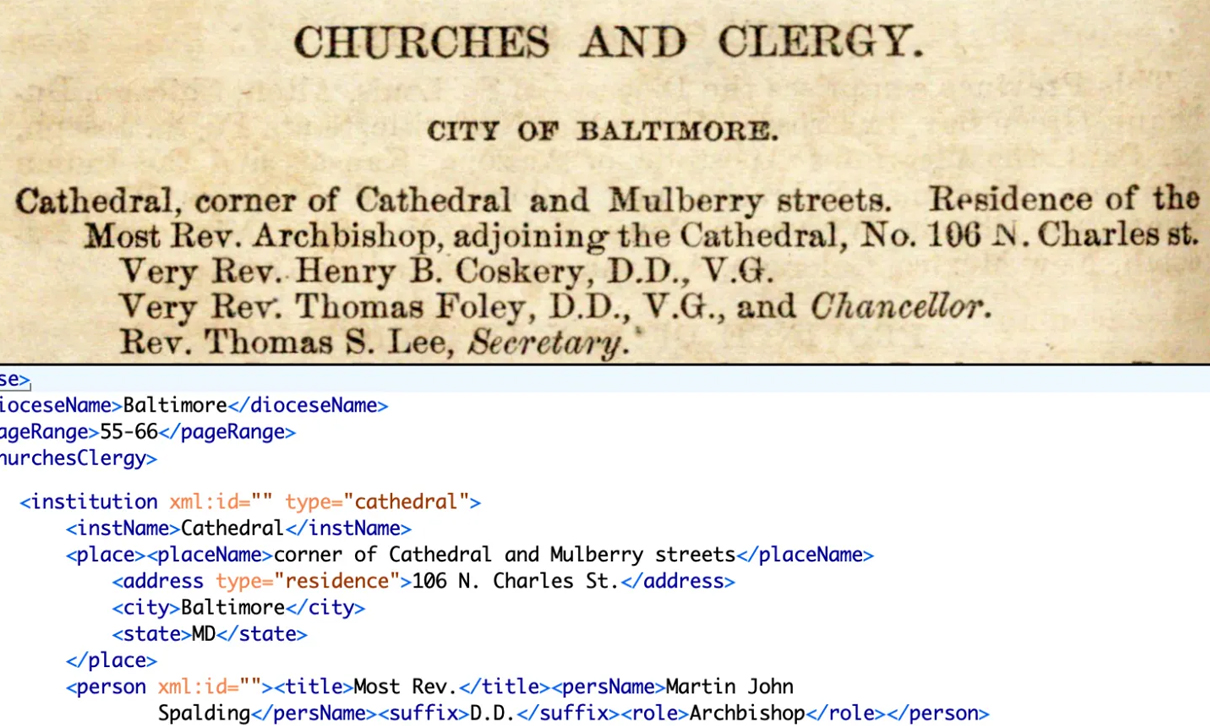
Catholic Almanacs Project Getting Off The Ground
One unexpectedly rich source about the history of Catholicism in the United States is a series of Catholic almanacs containing extensive data about US dioceses throughout the nineteenth century. Today, the almanacs are housed at Boston College Libraries, and some are digitized and made available by Villanova, HathiTrust, and the Internet Archive. Now, as part…
-
Building Data Tools for Exploring the Past
When most people think about data analysis and building databases, they don’t typically imagine using them for literature and music scholarship. But that’s precisely the work I’ve been doing this semester. With Professor Maia McAleavey, BC professor of English, I have been building an interactive web portal for a research project exploring the composition of…
-
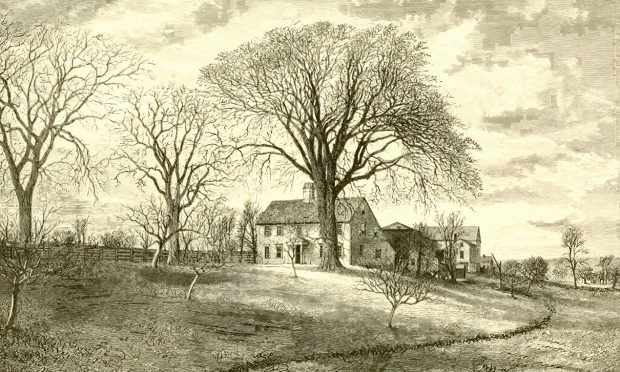
Finding Bradstreet: Going From the Material to the Digital
As an archeologist, I have excavated everywhere, from the deserts of Jordan to the hills of Tuscany in pursuit of cities, villas, and tombs, but never before have I dug to discover the life of a poet. That’s why I jumped at the chance when Dr. Christy Pottroff, BC Professor of English, invited me to…
-
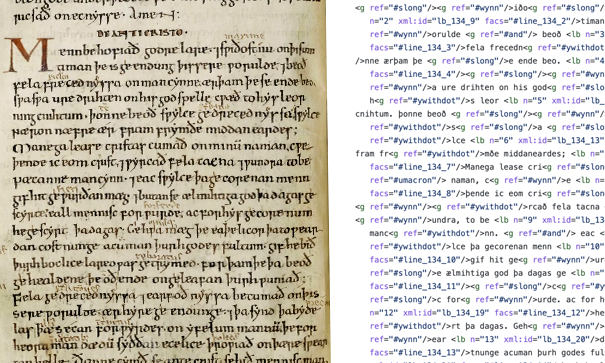
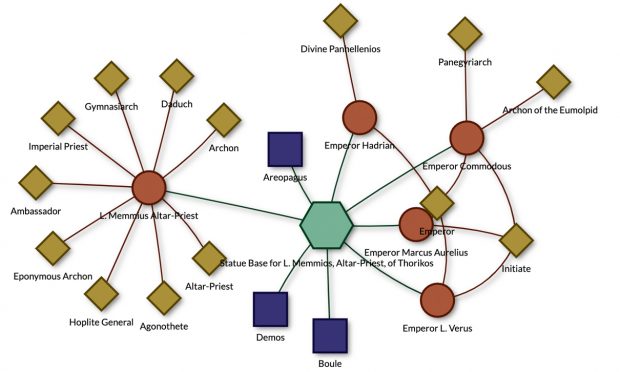
Digital Medieval Studies
I talk about creating my DH capstone project. How DH Has Helped Me Make Sense of My Field Early in my graduate studies, when I took the Digital Humanities Colloquium at Boston College, the professor had us read a series of definitions of “the Digital Humanities” to introduce us to the scope of the work…
You must be logged in to post a comment.