Tag: data visualization
-

May 2018 Data Visualization Display @ O’Neill Library
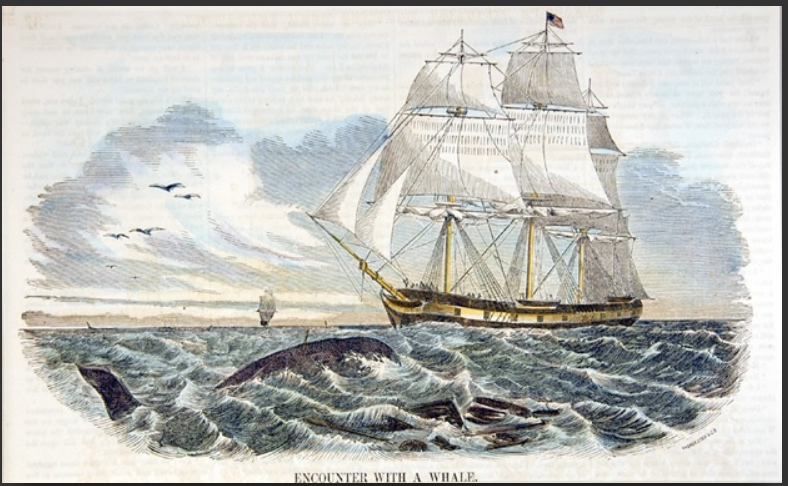
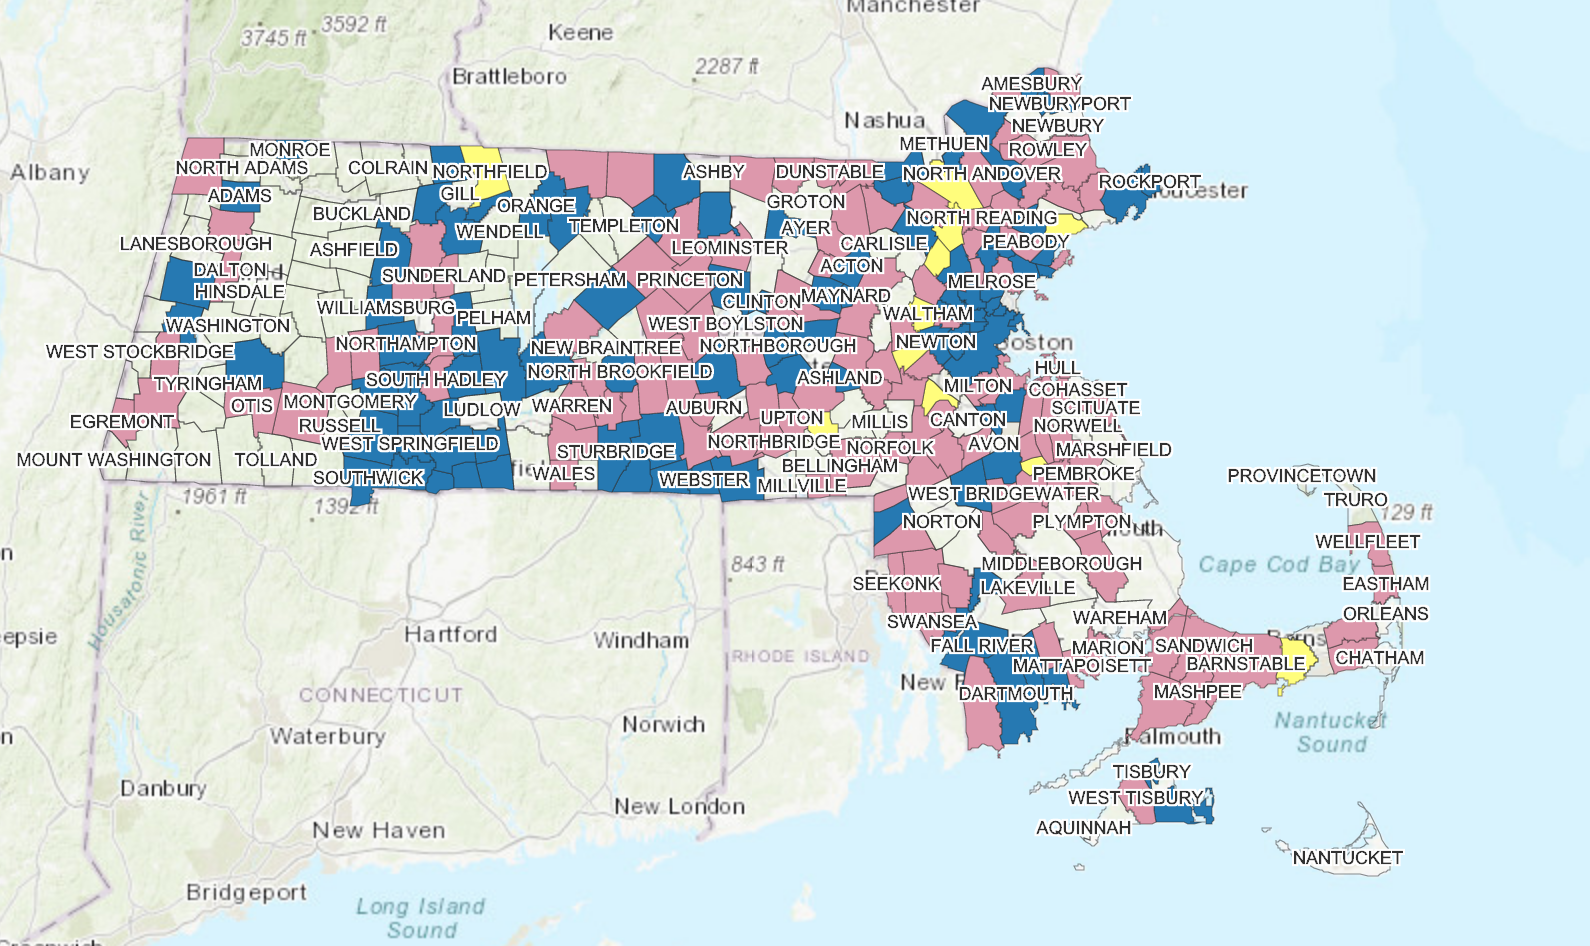
During the month of May, the O’Neill Library digital display (by the POP collection) will showcase a selection of data visualizations created by Boston College faculty, students, and staff. This month we are also including the winning visualizations from the 9th annual GIS Mapping contest. Each source is linked to the original site (when available)…
-

April 2018 – Data Visualization Display @ O’Neill
During the month of April, the O’Neill Library digital display (by the POP collection) will showcase a selection of data visualizations, which use a variety of tools and methods, such as GIS, data mining, network analysis, 3D visualization, and Tableau. Each source is linked to the original site where you can further explore the associated…